


BLACKOUT eCon WEEKLY | Aug. 21, 2026
This is commentary and education, not investment advice, and XPLisset is not an investment adviser, broker, or financial planner. Nothing here recommends buying, selling, or holding any security, bond, commodity, currency, or other asset. Consult a qualified professional who knows your circumstances.
Before we get into it, this is the Reader’s Cut of this week’s Blackout eCon. It is the standalone written edition of the reaction video, not a transcript and not a teaser for the “real” story somewhere else. The video lets you hear the tone shift inside this Fox Business segment. The Reader’s Cut slows that moment down, explains the bond machinery in plain language, checks the history against the record, and links the receipts so you lose nothing if you never press play.
The pitch comes back to me before the graph does. Around 2006 and 2007, I heard YouTubers hawking gold as if doomsday came with a coupon code. Later, I remember Glenn Beck working full-blown dollar-collapse scenarios across a Fox whiteboard. The emotional proposition was always the same: the system was about to break, everybody else was asleep, and you had to buy protection before it was too late.
Some of that fear attached itself to real fractures. The recession began in December 2007. Lehman Brothers failed in September 2008. America elected Barack Obama that November, and he entered the White House in January 2009. Beck’s Fox News program debuted one day before Obama’s inauguration.[1][2][3][4]
The chronology is not trivia. It is how a society assigns guilt, and the crisis came first. A Black president inherited the wreckage and the doomsday programming that followed. That is why I refuse to use the 2007 echo as a prophecy now. Memory should make us more exact, not more marketable.
That is the memory I brought to Donald Trump’s answer this week. Asked whether Americans should be concerned about the bond market, Trump said no. He called interest rates artificially high and ridiculous, then said the country was powering through them. Lydia Hu followed with the part the reassurance did not settle: yields had climbed back after the prior day’s relief, gross federal debt had crossed $40 trillion, and she asked whether Washington could keep borrowing at that pace without bond-market pushback. Dagen McDowell said Treasury’s move looked desperate and asked why a supposedly strong economy was running a huge deficit, paying a climbing interest bill, and intervening at the long end at all.[5]
The panel did not become unanimous, and Fox did not become a resistance network. That is not my claim. The signal is narrower and more useful: Trump’s reassurance did not carry the room. When a friendly network starts asking ordinary financial questions instead of treating the political answer as the financial answer, the normal tone becomes information.
The Aug. 20 New York Times report by Alan Rappeport and Colby Smith supplied the factual frame. It described Treasury Secretary Scott Bessent expanding the government’s role in the long-term bond market while arguing that investors were misreading the fundamentals. It also described a larger buyback plan, an initial dip in yields, and renewed upward pressure the next day.[6]
The official announcement is more precise than the shorthand. Treasury did not double every buyback. It said it would at least double the maximum size of liquidity-support buyback operations in two long-end sectors, from $2 billion to at least $4 billion per operation, for the 10-to-20-year and 20-to-30-year sectors from Sept. 9 through Nov. 4.[7]
The blood in the headline is not a crash prediction. It is the higher return the market demands to hold long-term Treasury debt and the budget pressure that accumulates as Washington refinances maturing obligations at newer rates. That process is slower than a doomsday whiteboard, but it is where market pressure can become public cost.[8][14]
TLDR
This Fox Business segment did not predict a crash. Its desk stopped treating reassurance as a complete answer. Trump said there was no reason to worry, but the discussion kept returning to the deficit, the interest bill, and Treasury’s intervention. The panel disagreed over the remedy, so the signal is the survival of the questions, not Fox suddenly “turning” on Trump.[5]
Treasury did not double the entire buyback program. It said the maximum operation size in two long-end liquidity-support sectors would rise from $2 billion to at least $4 billion for a defined period beginning Sept. 9. Treasury has not yet specified the final maximum beyond that floor. The program may improve market plumbing, but it is not the same thing as paying down the national debt.[7][10]
The old yield returned on top of a much larger debt load. The 30-year Treasury yield averaged 5.20 percent in June 2007. XVOA’s arithmetic average of the 13 available trading-day observations from Aug. 3 through Aug. 19, 2026 was a provisional 5.23 percent. XVOA’s calculation from Treasury’s two dated snapshots puts nominal debt held by the public at 6.62 times its August 2006 level. A separate XVOA calculation from CBO’s 35.4 percent historical share and 100.6 percent fiscal 2026 projection puts debt held by the public as a share of GDP at 2.84 times the fiscal 2006 share.[11][12][13][16]
Regular people feel this through borrowing costs and public budgets, not through a magic panic button. The 30-year mortgage usually tracks the 10-year Treasury rather than the 30-year bond, but long rates still shape the wider cost of credit. Federal interest pressure arrives gradually as cheap debt matures and deficits are financed at newer rates.[9][14]
This is a warning signal, not a crash clock or an investment call. The buybacks may improve liquidity. They cannot settle inflation, fiscal policy, Federal Reserve decisions, or the return long-term investors demand. The evidence supports watching the contradiction between reassurance and action. It does not support dating a collapse.[6][7]
If a politician’s reassurance and Treasury’s action are telling two different stories, this is exactly why the paid Reader’s Cut exists. Restack or send this preview so people can see the contradiction without needing a Bloomberg terminal. Then join the paid room at xplisset.com/subscribe for the full wiring: what a bond is, what the buyback changes, what the 2007 comparison proves, and who gets protected when high rates become budget pressure.
Paid subscriptions are the dependable base. If recurring support is not possible, Buy Me a Coffee is the flexible backstop. Thank you to everyone already inside.
What a Treasury bond has to do with your mortgage
A Treasury security is an IOU from the federal government: investors lend Washington money, and Washington promises interest plus repayment. Treasury bills are short term, notes run from two to ten years, and bonds mature in 20 or 30 years. Notes and bonds pay interest every six months.[8]
The coupon is the fixed interest payment attached to a particular security. The market yield is the annualized return implied by the security’s price and promised cash flows, assuming it is held under the stated terms. When buyers demand a higher yield, the price of an existing fixed-rate bond falls. When the demanded yield falls, its price rises. That inverse relationship is why a Treasury buyback can support market functioning and move yields without changing the coupon already printed on an old bond.[8]
This matters outside Wall Street because Treasury rates become reference points for borrowing across the economy. A 30-year mortgage is not pegged to the 30-year Treasury bond. It typically tracks the 10-year Treasury yield, plus a spread for mortgage-specific risk and costs. I am using the 30-year Treasury here as a long-duration stress gauge, not pretending it is your household mortgage rate.[9]
Long rates help shape the environment in which households seek mortgages, businesses refinance debt, pension funds value assets, and the federal government rolls over maturing obligations. This is not just Wall Street weather. A change in what investors demand from Washington eventually reaches public budgets and private borrowing, even though it does not reprice every loan on the same day.[9][14]
What Treasury actually changed
Treasury’s Aug. 19 release concerned liquidity-support buybacks. In plain English, Treasury can repurchase older outstanding securities that may be harder to trade. Primary dealers and other approved market participants submit offers, including offers for their customers, and accepted purchases can improve cash liquidity in specific parts of the market. Treasury has not yet specified the final maximum beyond saying it will be at least $4 billion per operation. Whatever maximum it sets will be a ceiling, not a promise that Treasury will accept that amount each time.[7][10]
A buyback is also not the government paying off the national debt in the household sense. Treasury can issue new securities while repurchasing old ones. Its own program materials describe buybacks as tools for liquidity support and cash management, and actual purchases depend on the offers Treasury receives.[10]
The word buyback can sound like Washington found spare cash under the couch. It did not. Treasury is changing the composition and tradability of debt while continuing to finance deficits. The policy may improve plumbing without repairing the fiscal structure that fills the pipes.
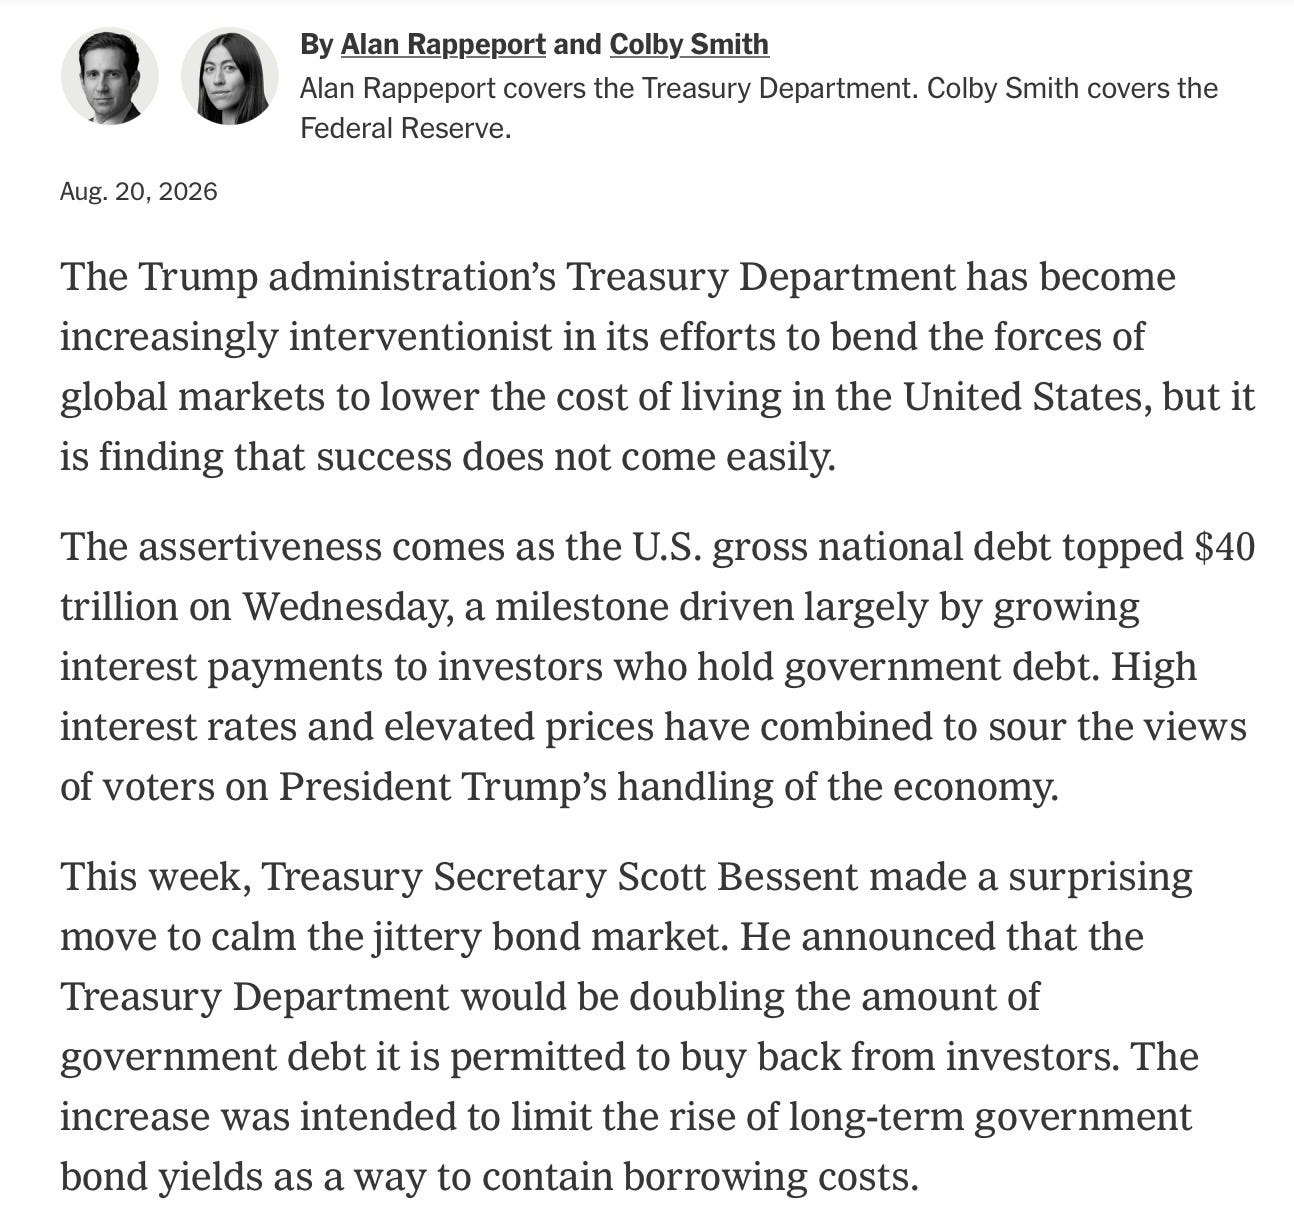
The Times called Bessent’s move surprising and interventionist. It reported that yields dipped after the announcement, then began rising again by Thursday. That price action does not prove the operation failed. It tells us the announcement did not erase the larger argument over inflation, debt supply, Federal Reserve policy, and the returns long-term buyers require.[6]
The Fox Business tell
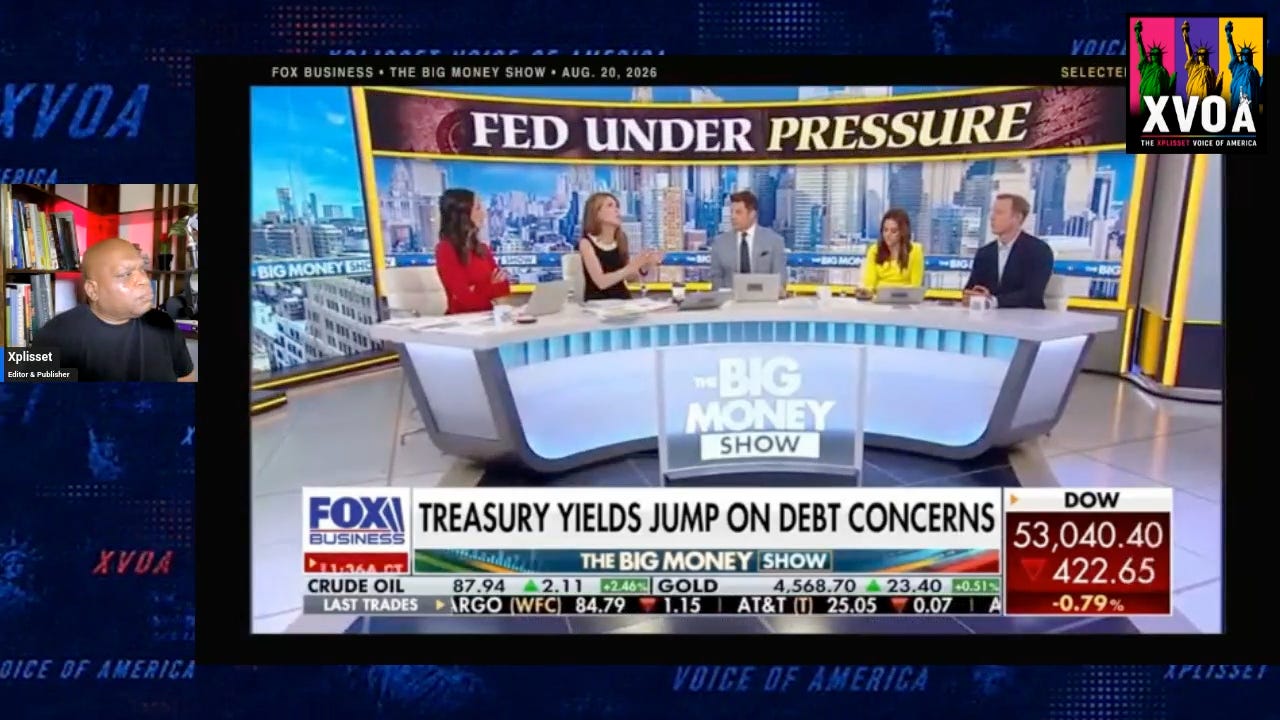
Fox Business supplied the political test. Trump offered confidence, while McDowell answered with arithmetic by citing roughly a $2 trillion deficit and about $1.4 trillion in fiscal-year interest costs. She then asked why rising yields should be treated as evidence of strength if Treasury was simultaneously trying to restrain them. Those figures are McDowell’s on-air framing, not the current CBO baseline.[5]
The longer panel argued over supply, growth, inflation, spending, Federal Reserve policy, and new corporate borrowing without reaching a common verdict. Lou Basenese objected to the intervention and said spending had to change. An unidentified male panelist defended Bessent and argued that lower rates would ease the government’s interest burden. The reaction video uses five clearly labeled excerpts from that longer discussion, not the full uncut segment, and several begin or end mid-argument. The disagreement strengthens the point: the signal is the range of questions that remained alive after the president said there was nothing to fear, not ideological conversion or panel unanimity.[5]
Ordinary financial questioning on a friendly network is not proof of a crash. It does show that the reassurance lost some power to close this conversation. The panel did not have to declare Bessent wrong for the tone to matter. It only had to let the contradiction stay visible.
The rate came back. The balance sheet underneath it exploded.
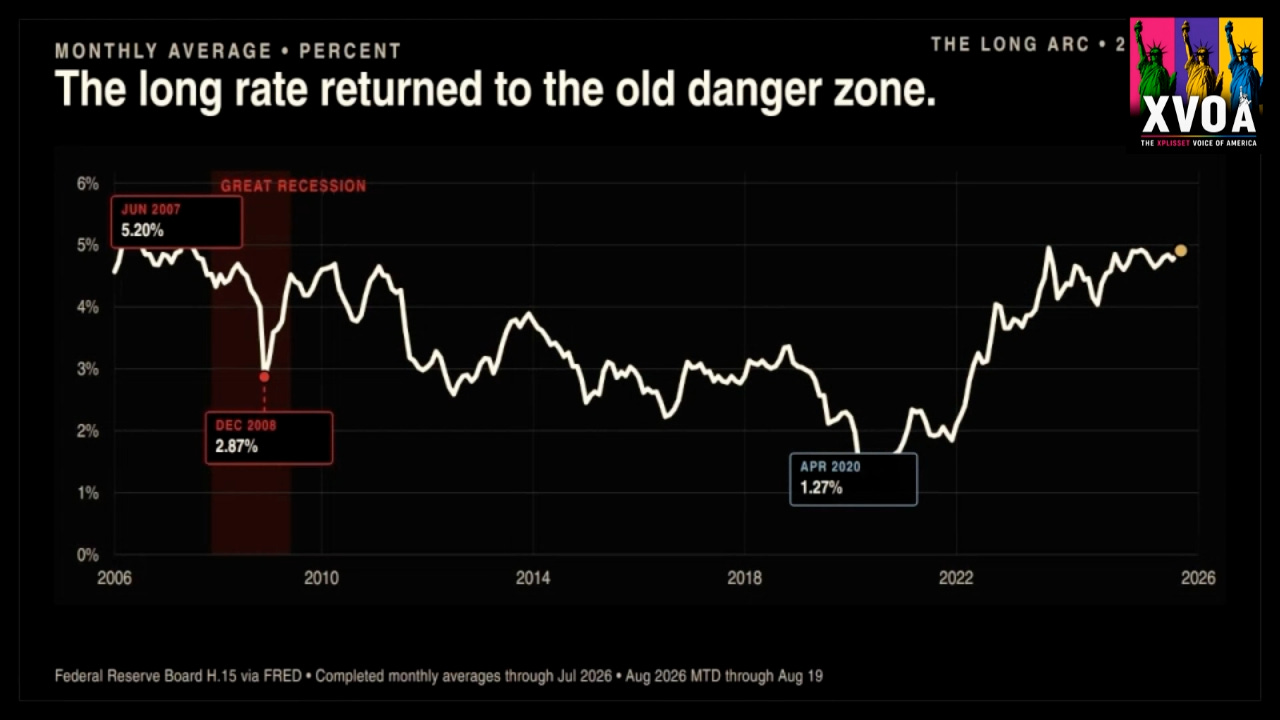
The Federal Reserve’s 30-year constant-maturity series averaged 5.20 percent in June 2007. It fell to a monthly average of 1.27 percent in April 2020.[11] XVOA’s arithmetic average of the 13 available trading-day observations from Aug. 3 through Aug. 19, 2026 was a provisional 5.23 percent.[12]
That is essentially the same yield territory as June 2007, but it is not the same economy or the same balance sheet. Treasury’s Debt to the Penny records show $4.874 trillion in debt held by the public on Aug. 21, 2006 and $32.264 trillion on Aug. 19, 2026. XVOA’s calculation from those two nominal snapshots is 6.62 times as much publicly held debt. The same calculation puts total public debt outstanding at 4.71 times its old level, from $8.503 trillion to $40.013 trillion.[13]
The old yield and old debt observations are not from the same date, so this is an era comparison, not a matched daily experiment. The dollar totals are nominal, not inflation-adjusted. A second measure controls better for the changing size of the economy: CBO’s February 2026 data put debt held by the public at 35.4 percent of GDP in fiscal 2006 and projected 100.6 percent for fiscal 2026. XVOA’s calculation makes that projected share 2.84 times the 2006 share.[16]
Do not multiply a 5.23 percent market yield by the full debt stock and call that the government’s interest bill. Federal interest expense depends on the maturity mix, the coupons attached to existing debt, new issuance, and the schedule on which old securities are refinanced. Existing fixed-rate debt does not reprice instantly. The pressure arrives over time as maturing cheap debt is replaced and new deficits are financed at prevailing rates.
That lag is one reason political reassurance can survive longer than the arithmetic. The cost does not appear as one cinematic invoice. It accumulates through auctions, refinancing, and annual budgets until interest consumes room that could have gone somewhere else.
Who gets paid, who pays, and who can wait
Higher yields are not universally bad. A new buyer of Treasury securities can receive a better return. A saver or pension fund seeking safe income may welcome that. A holder of an older low-coupon bond may see its market price fall, but someone able to hold the security to maturity still receives the promised coupon and principal, assuming the government pays as agreed.[8]
The burden falls differently on people who need credit now. A household trying to buy a home cannot live inside the mortgage rate a wealthier household locked years ago. A small business that must refinance cannot simply wait forever. The federal government has the greatest ability to keep borrowing, but its interest bill enters the budget and competes with every other public claim.[14]
CBO’s February baseline projects a fiscal 2026 deficit of about $1.9 trillion, debt held by the public near 101 percent of GDP, and net interest above $1 trillion. CBO also projects net interest reaching roughly $2.1 trillion in 2036 under current law.[14] That is not a mechanical forecast of cuts to one named program. It is a widening field for political choice: raise revenue, reduce other spending, accept more borrowing, or combine those options.
The ability to benefit from higher asset income is not evenly distributed. In the Federal Reserve’s 2022 Survey of Consumer Finances, the typical White family held about $285,000 in wealth while the typical Black family held about $44,900. The Fed also found that investment income contributed far more to recent income growth for White families than for non-White families, who held fewer of those assets.[15]
That survey does not tell us the race of every Treasury holder, and it should not be used that way. It tells us something more basic: the capacity to earn from high yields, absorb a bond-price loss, wait out a refinancing cycle, or buy a home with cash is unequal before the policy response begins. The same interest-rate environment can be income for one household, a locked door for another, and a future budget fight for everybody.
2007 is memory, not prophecy
The 5.20 percent line from June 2007 is an anchor, not an oracle. Equal-looking yields across two moments do not create equal causes or equal outcomes. The banking system, inflation backdrop, regulation, household leverage, global capital flows, and Federal Reserve balance sheet are not frozen in time.
What the comparison does is strip away a comforting illusion. A long rate near the old level can now operate against a much larger nominal debt stock and a far higher debt-to-GDP ratio. On this measure, the burden underneath the rate is worse. That is a specific claim about federal debt, not a declaration that every part of the economy is worse than 2007.
The older doom sellers taught the wrong lesson because certainty was the product. Yes, the economy fell into recession. Yes, the financial system cracked open in 2008. But the crisis was underway before Obama entered the White House, and Beck’s Fox program began the day before the inauguration.[1][2][3][4]
That sequence matters because economic pain is often produced under one set of choices, delayed by market machinery, and assigned politically to the person standing nearest the wreckage. Black historical memory requires us to watch the lag. It also requires us not to manufacture a new certainty just because the old fear rhymes.
What Treasury cannot control
Treasury can alter issuance and buyback operations in ways that affect the timing, composition, and liquidity of federal debt.[7][10] The Federal Open Market Committee sets a target range for the federal funds rate, and the Fed uses policy tools to keep overnight rates in that range.[17] Neither institution can command long-term investors to accept a return that does not compensate them for expected inflation, fiscal risk, duration, and competing places to put money.
The Times identified several pressures beyond Treasury’s direct control, including the fiscal outlook, inflation, uncertainty about Federal Reserve policy, and a wave of corporate debt issuance tied to the artificial-intelligence build-out. It also reported that Bessent had leaned more heavily on short-term bills, a strategy similar to one he criticized when Janet Yellen led Treasury, and that officials had intervened in the yen market to reduce the danger of Japanese Treasury sales.[6]
Those moves can change timing, liquidity, and the location of pressure. They cannot make the structural conflict disappear. The government is financing persistent deficits in a market that wants compensation for carrying long-term risk. Moving more borrowing to the short end can reduce today’s long-term supply, but it also exposes more debt to near-term refinancing.
When the larger operations begin Sept. 9, the next evidence will be measurable. The accepted amount will matter more than the announced ceiling. So will the long rate after each operation, the Nov. 4 Quarterly Refunding, and any extension or expansion Treasury announces. Inflation and Federal Reserve policy remain outside the program’s reach. A buyback cannot settle a fight over the future price level.[7]
What the evidence can carry
The evidence proves that Treasury announced it would raise the maximum size of buyback operations in two long-end sectors beginning Sept. 9. XVOA’s month-to-date calculation put the 30-year measure at 5.23 percent through Aug. 19, near its June 2007 average. XVOA’s calculations put nominal debt held by the public at 6.62 times its August 2006 level and CBO’s projected fiscal 2026 debt-held-by-the-public share of GDP at 2.84 times its fiscal 2006 level.[7][11][12][13][16]
The record strongly suggests that Trump’s reassurance was not sufficient to close this Fox Business discussion. Treasury says the action is intended to support long-end liquidity. The Times report and Fox discussion treat the move as evidence of concern about broader borrowing conditions, whether or not one accepts McDowell’s description that it looked desperate. The ordinary questions in this segment are a signal that the contradiction had become too visible to cheerlead away.[5][6][7]
We still do not know whether the larger buybacks will produce durable liquidity gains, where the yield goes next, what the Federal Reserve will do, or whether any of this becomes a crisis. A chart cannot date a crash, and a television panel cannot price a bond.
The standard to carry forward is simpler. When an official says not to worry, look for the action taken behind the reassurance. Then ask who receives the interest, who needs to refinance, who can wait, and which public obligation will be told there is no money left.
Support XVOA
Paid members made this Reader’s Cut possible. Thank you for funding the time it took to inspect the footage, rebuild the chronology, check the market data, and separate a warning signal from a sales pitch. The next Blackout eCon will keep following the long-end operations when they begin in September.
If you are already supporting the paid room and want to add something extra, Buy Me a Coffee is the optional flexible lane. Share or Restack the report if it gave you a clearer instrument, but your paid membership has already done the job it was built to do.
Sources
NBER, Business Cycle Dating Committee Announcement. Establishes December 2007 as the start of the recession.
Federal Reserve History, Support for Specific Institutions. Establishes Lehman Brothers’ Sept. 15, 2008 bankruptcy in the financial-crisis chronology.
Obama Presidential Library, President Barack Obama. Establishes Obama’s Nov. 4, 2008 election and Jan. 20, 2009 inauguration.
Fox News archive, Glenn Beck program debut announcement. Establishes the Jan. 19, 2009 debut date of Beck’s Fox News program.
Fox Business, The Big Money Show, Aug. 20, 2026. Provides Trump’s reassurance and the panel’s debate over deficits, interest costs, Treasury intervention, inflation, and bond supply.
The New York Times, “Treasury Turns to Interventionist Tactics to Lower Interest Rates”. Supplies the Rappeport and Smith reporting on Bessent’s strategy, market reaction, process, and pressures outside Treasury’s control.
U.S. Treasury, “Treasury Announces Increased Sizes of Nominal Long-End Liquidity Support Buybacks Beginning September 9”. Defines the affected sectors, maximum operation sizes, dates, and stated liquidity-support purpose.
TreasuryDirect, Understanding Pricing and Interest Rates. Explains Treasury maturities, coupons, yields, and the inverse relationship between bond prices and yields.
Federal Reserve Bank of St. Louis, “Mortgage Rates Not Matching Declines in Treasury Yields”. Explains the usual relationship between 30-year mortgage rates and the 10-year Treasury yield, including the variable spread.
TreasuryDirect, Treasury Buybacks FAQs. Explains liquidity-support and cash-management buybacks and why announced maximums need not equal accepted purchases.
Federal Reserve H.15 via FRED, 30-Year Treasury Constant Maturity monthly series. Supplies the June 2007 and April 2020 monthly averages.
Federal Reserve H.15 via FRED, August 2026 daily observations. Supplies the observations used for XVOA’s 5.23 percent month-to-date calculation through Aug. 19.
U.S. Treasury Fiscal Data, exact Debt to the Penny records. Supplies the Aug. 21, 2006 and Aug. 19, 2026 debt-held-by-the-public and total-debt records used in XVOA’s calculations.
Congressional Budget Office, The Budget and Economic Outlook: 2026 to 2036. Supplies the fiscal 2026 deficit and debt baseline, the projected net-interest path, and the report’s current-law assumptions.
Federal Reserve Board, “Greater Wealth, Greater Uncertainty”. Supplies 2022 Survey of Consumer Finances evidence on racial wealth levels and the distribution of investment income.
Congressional Budget Office, Key Budget and Economic Data. Provides the February 2026 10-year projection workbook and historical budget workbook used for XVOA’s 35.4 percent, 100.6 percent, and 2.84-times comparison.
Federal Reserve Board, Open Market Operations. Explains the FOMC’s federal-funds target and the Fed’s use of policy tools to implement that target in overnight markets.

